
I have a very simple point to make for you today: that because human material wellbeing depends heavily on access to abundant, affordable, reliable energy, and because fossil fuels are and for the foreseeable future will be, along with nuclear, our best source of such energy, the demand to reduce our use of fossil fuels to reduce our CO2 emissions to reduce manmade global warming amounts to a demand to reduce human material wellbeing. I’m going to illustrate that with 8 simple slides demonstrating the relationship between hydrocarbon fuel use and three simple measures of human wellbeing: infant and child mortality, which as we shall see falls with increasing hydrocarbon energy consumption and its concomitant CO2 emissions; human life expectancy, which rises with increasing hydrocarbon fuel use and CO2 emissions; and income per capita, which rises with increasing hydrocarbon energy consumption and CO2 emissions.
The data in the first four slides come from the World Bank and other official sources as aggregated and graphed by the Gapminder World website. The data for the next slide come from Robert Zubrin. And the data for the sixth slide come from the IPCC.
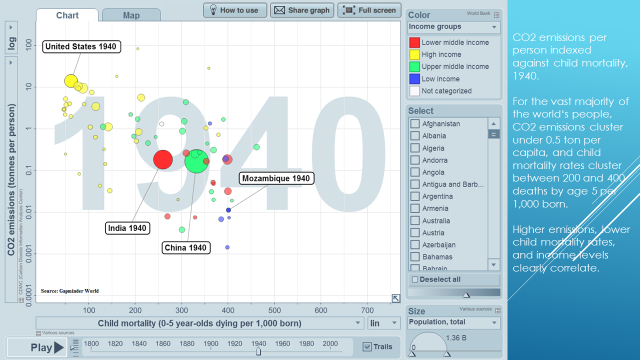
This first slide graphs CO2 emissions per person against child mortality in 1940. Each circle represents a country, the circle sizes indicating relative population, and the colors representing GDP per capita by nation—yellow being high, green upper middle, red lower middle, blue low, and colorless not categorized. The higher a circle falls on the scale, the higher the per capita emissions of CO2. The farther to the right a circle falls, the higher the child mortality rate. By that measure of human wellbeing, we should want to see the circles moving leftward over time, indicating declining child mortality.
In 1940, for the vast majority of the world‘s people, CO2 emissions clustered under 0.5 ton per capita, and child mortality rates clustered between 200 and 400 deaths by age 5 per 1,000 born. Higher emissions, lower child mortality rates, and higher income levels clearly correlate.
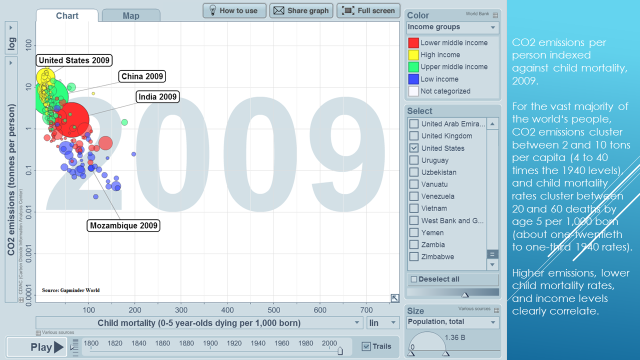
This second slide graphs the same information for 2009, 69 years later. As we hoped, the circles have shifted to the left, showing declining child mortality rates; they have also shifted upward, showing rising CO2 emissions.
In 2009, for the vast majority of the world‘s people, CO2 emissions cluster between 2 and 10 tons per capita (4 to 40 times the 1940 levels), and child mortality rates cluster between 20 and 60 deaths by age 5 per 1,000 born (about one-third to one-twentieth the 1940 rates) Higher emissions, lower child mortality rates, and higher income levels clearly correlate.
Now we’ll compare 1940 and 2009 measures of human life expectancy. Here the colors, sizes, and vertical positions of the circles represent income levels, population sizes, and CO2 emissions per capita as before, but their horizontal location represents life expectancy. If we value human life, we want to see these circles shift toward the right over time, indicating rising life expectancy.
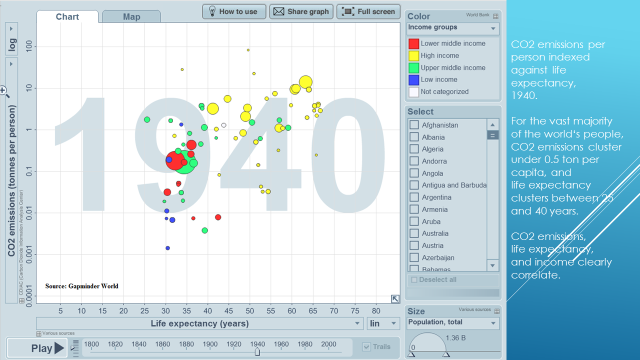
In 1940, For the vast majority of the world‘s people, CO2 emissions cluster under 0.5 ton per capita, and life expectancy clusters between 25 and 40 years. CO2 emissions, life expectancy, and income clearly correlate.
Remember, improvement in human wellbeing by this measure will be illustrated by the circles’ shifting to the right. What do we find?
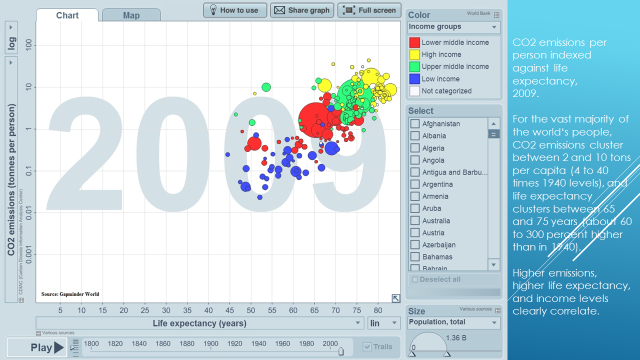
In 2009, For the vast majority of the world‘s people, CO2 emissions cluster between 2 and 10 tons per capita (4 to 40 times 1940 levels), and life expectancy clusters between 65 and 75 years (about 60 to 300 percent higher than in 1940). Higher emissions, higher life expectancy, and income levels clearly correlate. As we hoped, the circles have shifted toward the right, indicating higher life expectancy; they have also shifted upward, indicating higher CO2 emissions per capita.
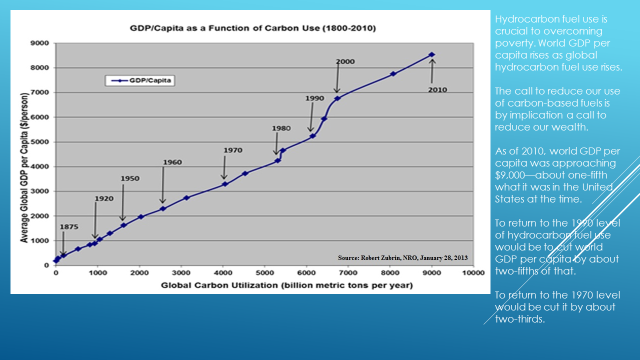
This next slide graphs GDP per capita, on the vertical scale, as a function of hydrocarbon fuel use, on the horizontal scale, from 1800 to 2010. If we value human material wellbeing, we want to see GDP per capita rising; it does so only as hydrocarbon fuel use also rises.
Hydrocarbon fuel use is crucial to overcoming poverty. World GDP per capita rises as global hydrocarbon fuel use rises.
The call to reduce our use of carbon-based fuels is by implication a call to reduce our wealth. As of 2010, world GDP per capita was approaching $9,000—about one-fifth what it was in the United States at the time. To return to the 1990 level of hydrocarbon fuel use would be to cut world GDP per capita by about two-fifths of that. To return to the 1970 level would be cut it by about two-thirds.
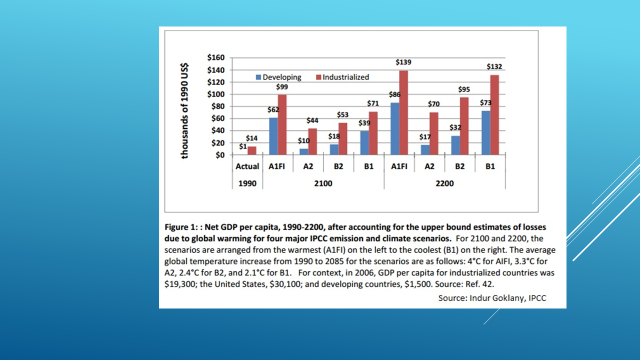
This next slide reproduces a figure from the IPCC’s Fourth Assessment Report (2007) and shows that by the IPCC’s coupled climate and economic modeling, the world’s poorer nations measured by per capita income become richest at the end of this century and the next under the warmest scenario. Why does that happen? Because the climate models derive the magnitude of warming from the amount of economic growth. The reason they do so is that they assume the economic growth to be driven primarily by fossil fuel use; the lower the fossil fuel use (i.e., the more successful the efforts to mitigate warming by reducing CO2 emissions), the lower the economic growth, and vice versa, the higher the fossil fuel use, the higher the economic growth.
In other words, even according to the IPCC’s own modeling, fighting global warming does more harm than good as measured by income per capita.
Why is this important? Because of this simple insight: The wealthier you are, the more different climates in which you can thrive, and the better able you are to survive extreme weather.
The corollary is that the poorer you are, the less able you are to thrive in any climate, or to survive any extreme weather event.
These insights yield this implication: Since abundant, affordable, reliable energy promotes wealth, and nuclear and fossil fuels are now and for the foreseeable future will be our best sources of said energy, those sources enhance human thriving and survival, and human thriving and survival are reduced proportionate to the reduction in humans use of them.
They also yield this further implication: Robert Zubrin’s book Merchants of Despair: Radical Environmentalists, Criminal Pseudo-Scientists, and the Fatal Cult of Antihumanism is right: The climate alarmist movement, by advocating for less use of fossil fuels, implicitly advocates for less human thriving and less human survival. I.e., the movement is implicitly, even when not explicitly, antihuman.
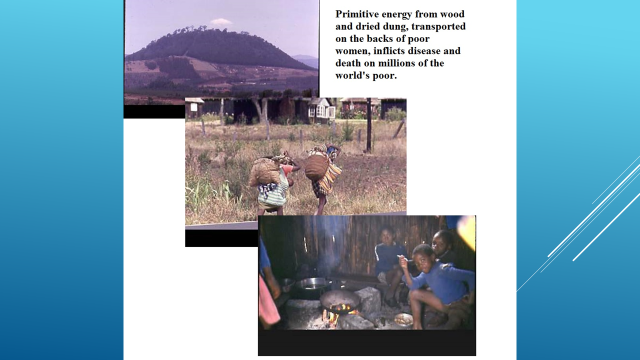
The primitive energy system dominant among the world’s poorest 1.3 or so billion people works this way as it does in sub-Saharan Africa. The average woman there spends 6 to 8 hours per day—leaving her precious little time and bodily energy for other productive activities to lift herself and her children out of poverty—gathering wood and dung as her primary cooking and heating fuel, smoke from which kills about 4 million a year, mostly women and children, and debilitates hundreds of millions for varying periods and at varying degrees because of the upper respiratory diseases it causes.
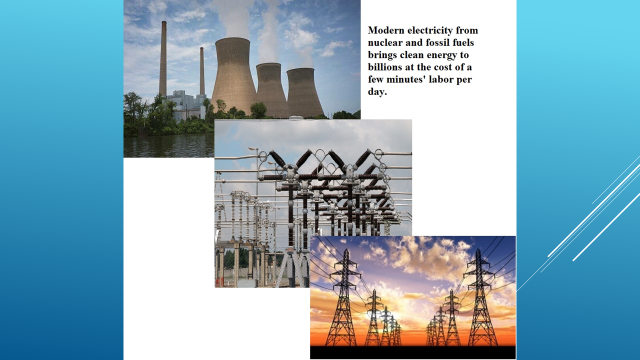
The poor of this world desperately need to replace that primitive energy system with the modern one in which coal, natural gas, and nuclear materials are used to generate clean electricity delivered at scale through grids not only for cooking and heating but also for light and refrigeration and automated clothes washing and drying and computing and industry and business and commerce and health care.
The campaign to fight global warming by reducing fossil fuel use is at bottom a campaign to retain the primitive energy system and its accompanying low incomes and high rates of disease and premature death. It is in fact a campaign of antihumanism.
It follows that such a policy should be taken only if its benefits clear exceed its costs, and that can only be true if the amount of warming caused by our CO2 emissions is very high indeed. I leave it to others in today’s program to demonstrate that that is not so.
i thank you for your efforts to debunk the AGW “Faith Healers of the Earth”.
I thank you for your efforts.
https://www.computerworld.com/article/2919134/sustainable-it/mit-says-solar-power-fields-with-trillions-of-watts-of-capacity-are-on-the-way.html
https://www.huffingtonpost.ca/2015/05/07/eden-full-sunsaluter_n_7173600.html What is the cause or issue that you’re most interested in seeing solved over the next 10 years?
Professionally, I care very much about energy poverty.