UAH v6.1 Global Temperature Update for February, 2025: +0.50 deg. C

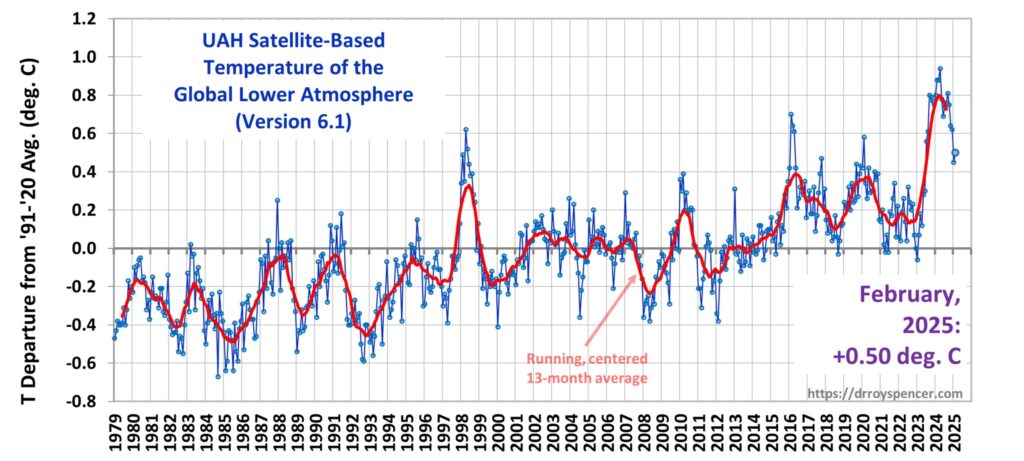
The Version 6.1 global average lower tropospheric temperature (LT) anomaly for February, 2025 was +0.50 deg. C departure from the 1991-2020 mean, up a little from the January, 2025 anomaly of +0.45 deg. C. The Version 6.1 global area-averaged linear temperature trend (January 1979 through February 2025) remains at +0.15 deg/ C/decade (+0.22 C/decade over […]

UAH v6.1 Global Temperature Update for February, 2025: +0.50 deg. C Learn More »

Human-induced Global Warming—A Little, or a Lot?

Cornwall Alliance Senior Fellow Roy W. Spencer’s monthly graph of global lower atmosphere temperature anomaly for March 2017 shows we’re still cooling from the super-El Nino that so warmed 2016. Track your eye straight left from the farthest-right point and you’ll see that there’s little change from the anomalies of roughly 2001–2006, and of course

Human-induced Global Warming—A Little, or a Lot? Learn More »

To Magnify Apparent Climate Risk, Magnify Temperature Data

In the early 1990s, working partly as a freelance book editor, I had the privilege of being the main managing editor of Julian L. Simon’s (edited) The State of Humanity (Blackwell, 1995). One of my responsibilities was turning raw data from the book’s 60 authors into graphs so people could grasp them better. But the graphs

To Magnify Apparent Climate Risk, Magnify Temperature Data Learn More »