[The article below by Cornwall Alliance Senior Fellow Dr. Roy W. Spencer, reprinted from his blog by permission, reports that the linear warming trend from 1970–2017 was 0.13 deg. C per decade. The computer climate models on which the UN Intergovernmental Panel on Climate Change, the UN Framework Convention on Climate Change, and the negotiators of the 2015 Paris climate agreement rely simulate a warming trend of 0.216 deg. C per decade, i.e., two-thirds faster than actually measured, and that assumes that all the warming is driven solely by added carbon dioxide, though it’s likely that most or all comes from other factors (solar, volcanic, and ocean current variabilities) instead. Observational data continue to show that the models grossly exaggerate CO2’s warming effect and therefore provide no sound basis for climate and energy policy.—ECB]
UAH Global Temperature Update for December, 2017: +0.41 deg. C
January 2nd, 2018 by Roy W. Spencer, Ph. D.
2017 Third Warmest in the 39-Year Satellite Record
Global Satellite Monitoring of Temperature Enters its 40th Year
The Version 6.0 global average lower tropospheric temperature (LT) anomaly for December, 2017 was +0.41 deg. C, up a little from the November, 2017 value of +0.36 deg. C:
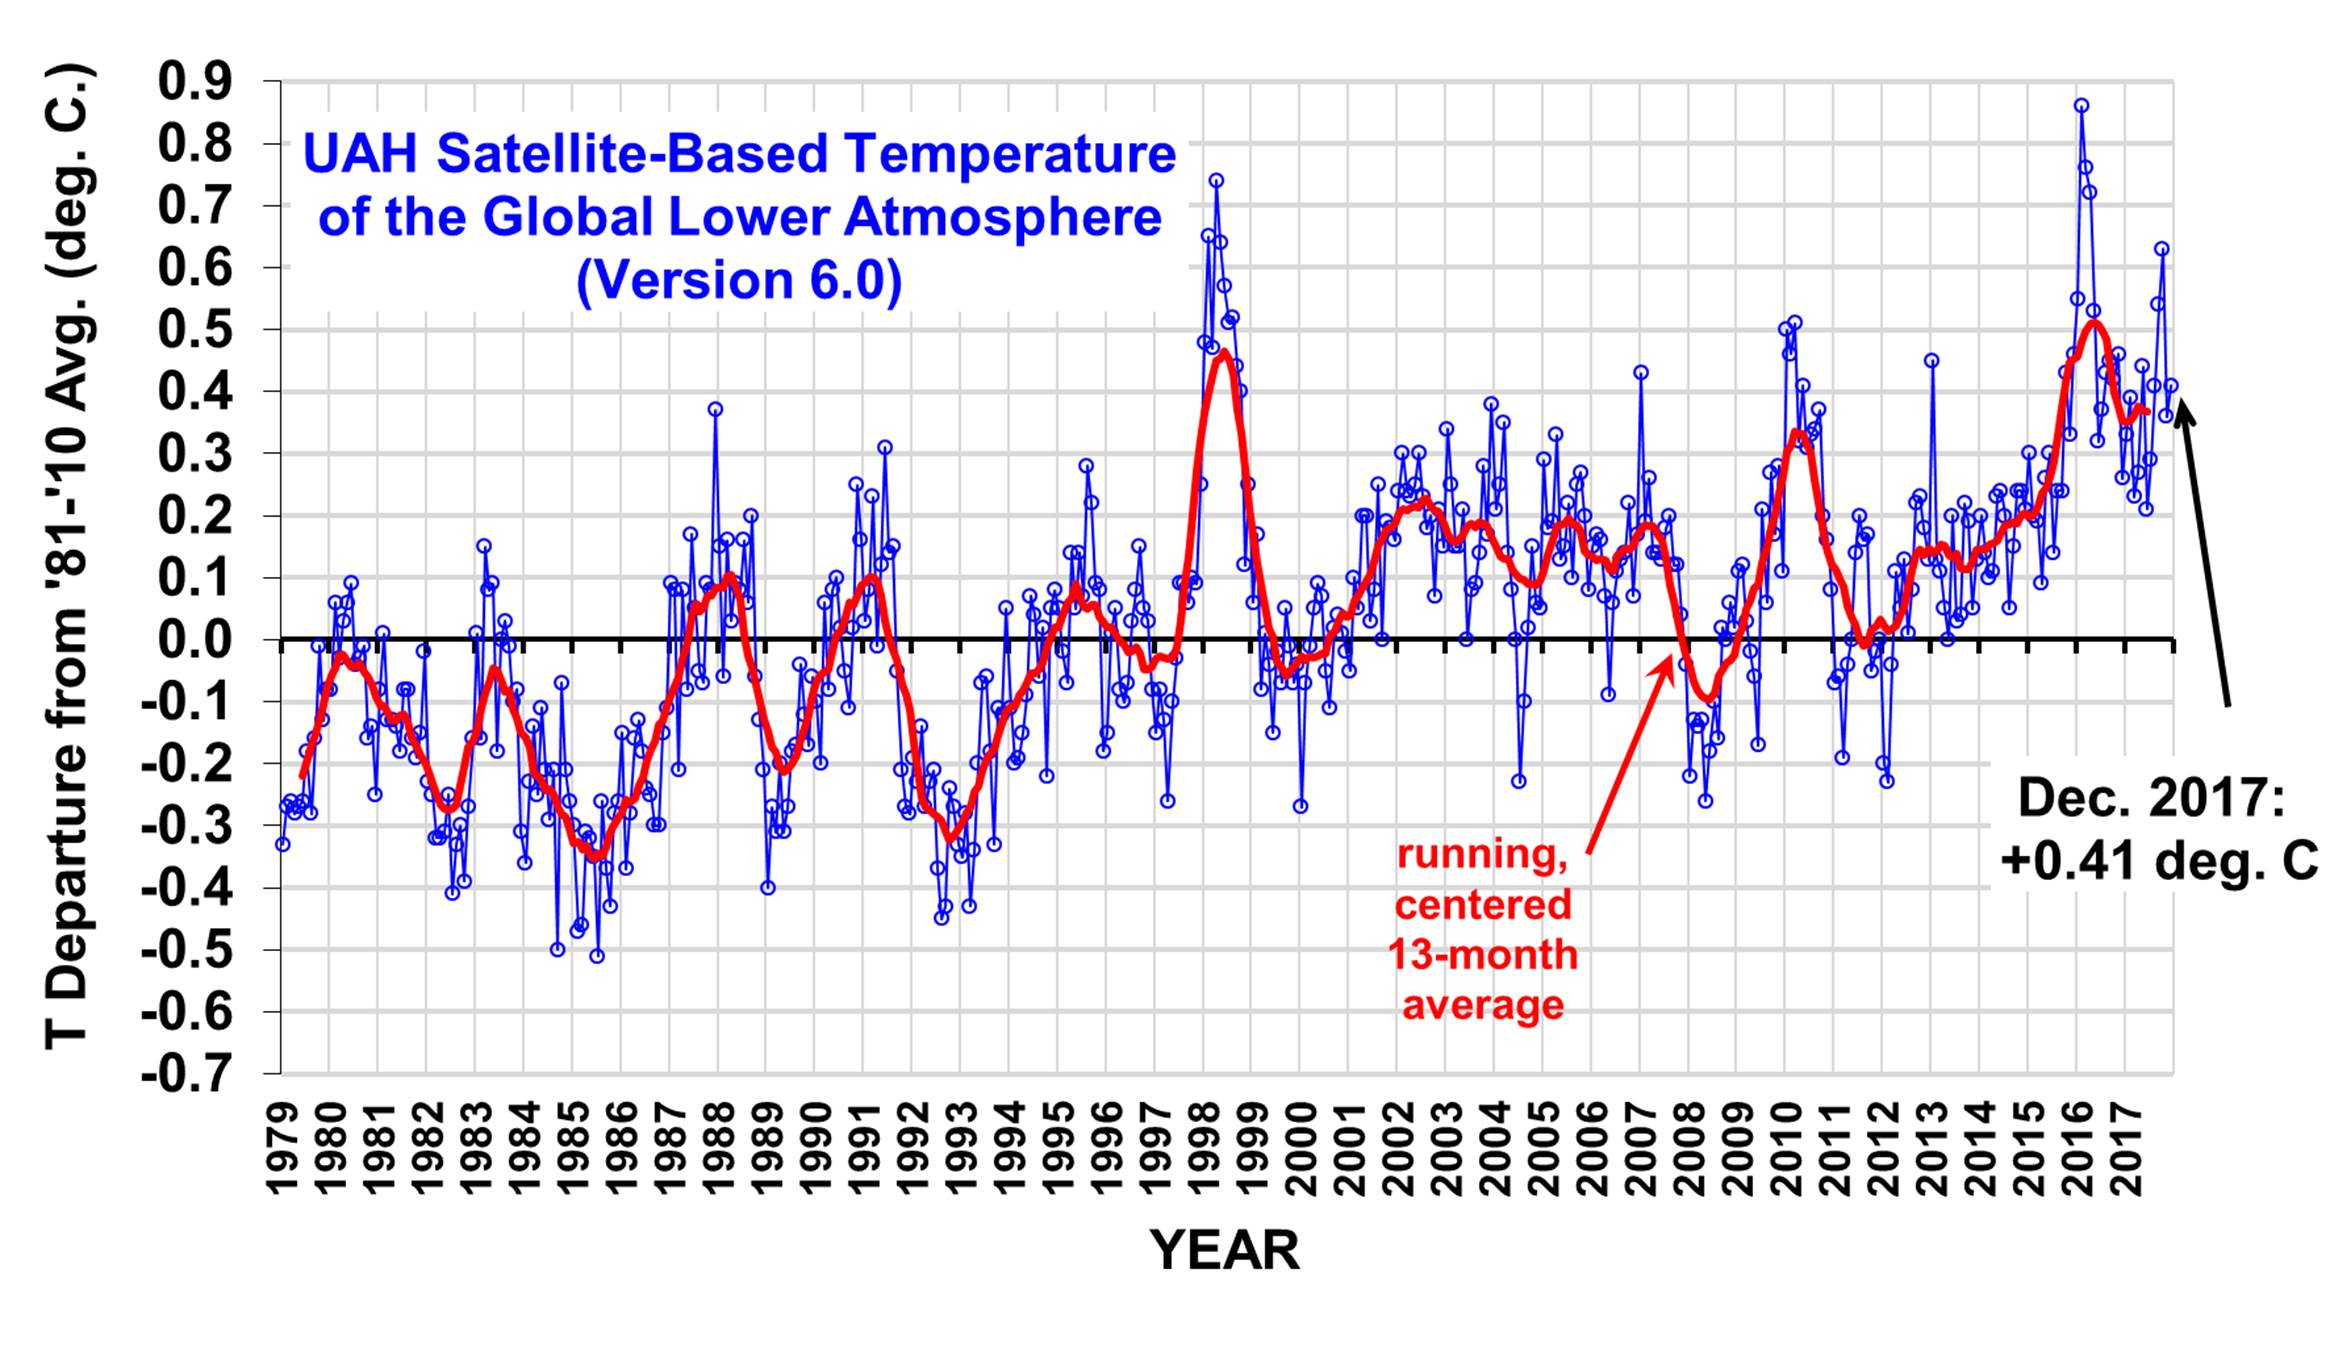
Global area-averaged lower tropospheric temperature anomalies (departures from 30-year calendar monthly means, 1981-2010). The 13-month centered average is meant to give an indication of the lower frequency variations in the data; the choice of 13 months is somewhat arbitrary… an odd number of months allows centered plotting on months with no time lag between the two plotted time series. The inclusion of two of the same calendar months on the ends of the 13 month averaging period causes no issues with interpretation because the seasonal temperature cycle has been removed as has the distinction between calendar months.
The global, hemispheric, and tropical LT anomalies from the 30-year (1981-2010) average for the last 24 months are:
YEAR MO GLOBE NHEM. SHEM. TROPICS
2016 01 +0.55 +0.72 +0.38 +0.85
2016 02 +0.85 +1.18 +0.53 +1.00
2016 03 +0.76 +0.98 +0.54 +1.10
2016 04 +0.72 +0.85 +0.58 +0.93
2016 05 +0.53 +0.61 +0.44 +0.70
2016 06 +0.33 +0.48 +0.17 +0.37
2016 07 +0.37 +0.44 +0.30 +0.47
2016 08 +0.43 +0.54 +0.32 +0.49
2016 09 +0.45 +0.51 +0.39 +0.37
2016 10 +0.42 +0.43 +0.42 +0.47
2016 11 +0.46 +0.43 +0.49 +0.38
2016 12 +0.26 +0.26 +0.27 +0.24
2017 01 +0.32 +0.31 +0.34 +0.10
2017 02 +0.38 +0.57 +0.19 +0.07
2017 03 +0.22 +0.36 +0.09 +0.05
2017 04 +0.27 +0.28 +0.26 +0.21
2017 05 +0.44 +0.39 +0.49 +0.41
2017 06 +0.21 +0.33 +0.10 +0.39
2017 07 +0.29 +0.30 +0.27 +0.51
2017 08 +0.41 +0.40 +0.41 +0.46
2017 09 +0.54 +0.51 +0.57 +0.54
2017 10 +0.63 +0.67 +0.59 +0.47
2017 11 +0.36 +0.33 +0.38 +0.26
2017 12 +0.41 +0.50 +0.33 +0.26
The linear temperature trend of the global average lower tropospheric temperature anomalies from January 1979 through December 2017 remains at +0.13 C/decade.
2017 ended up being the 3rd warmest year in the satellite record for the globally-averaged lower troposphere, at +0.38 deg. C above the 1981–2010 average, behind 1st place 1998 with +0.48 deg. C, and 2nd place 2016 at +0.44 deg. C. Thus, despite recent warmth, we are now entering the 20th year without beating the record warmth of 1998.
The UAH LT global anomaly image for December, 2017 should be available in the next few days here.
The new Version 6 files should also be updated in the coming days, and are located here:
Lower Troposphere: https://vortex.nsstc.uah.edu/data/msu/v6.0/tlt/uahncdc_lt_6.0.txt
Mid-Troposphere:https://vortex.nsstc.uah.edu/data/msu/v6.0/tmt/uahncdc_mt_6.0.txt
Tropopause:https://vortex.nsstc.uah.edu/data/msu/v6.0/ttp/uahncdc_tp_6.0.txt
Lower Stratosphere: https://vortex.nsstc.uah.edu/data/msu/v6.0/tls/uahncdc_ls_6.0.txt
[A reader notified us that the headline stating “After 20 Years, No New Global Temperature Record” was technically incorrect, since 2016 was 0.03 deg C warmer than 1998. We acknowledge the error and thank the reader but would note that since 0.03 deg C is well within the margin of measurement error the difference between 2016 and 1998 is statistically insignificant. So, did 2016 set a “new global temperature record”? We don’t know.—ECB]