UAH v6.1 Global Temperature Update for December, 2025: +0.30 deg. C
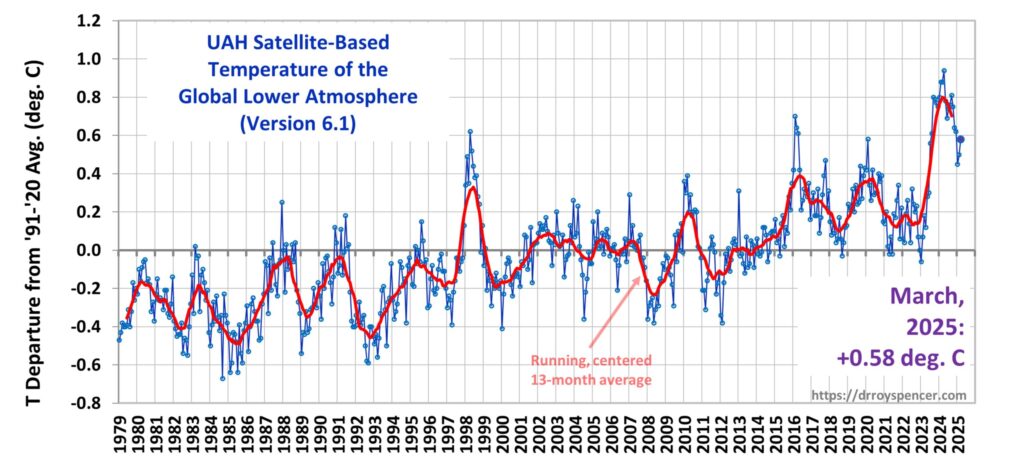
2025 was the 2nd warmest year (a distant 2nd behind 2024) in the 47-year satellite record The Version 6.1 global average lower tropospheric temperature (LT) anomaly for December, 2025 was +0.30 deg. C departure from the 1991-2020 mean, down from the November, 2025 value of +0.43 deg. C. (In the following plot note that the […]
UAH v6.1 Global Temperature Update for December, 2025: +0.30 deg. C Learn More »