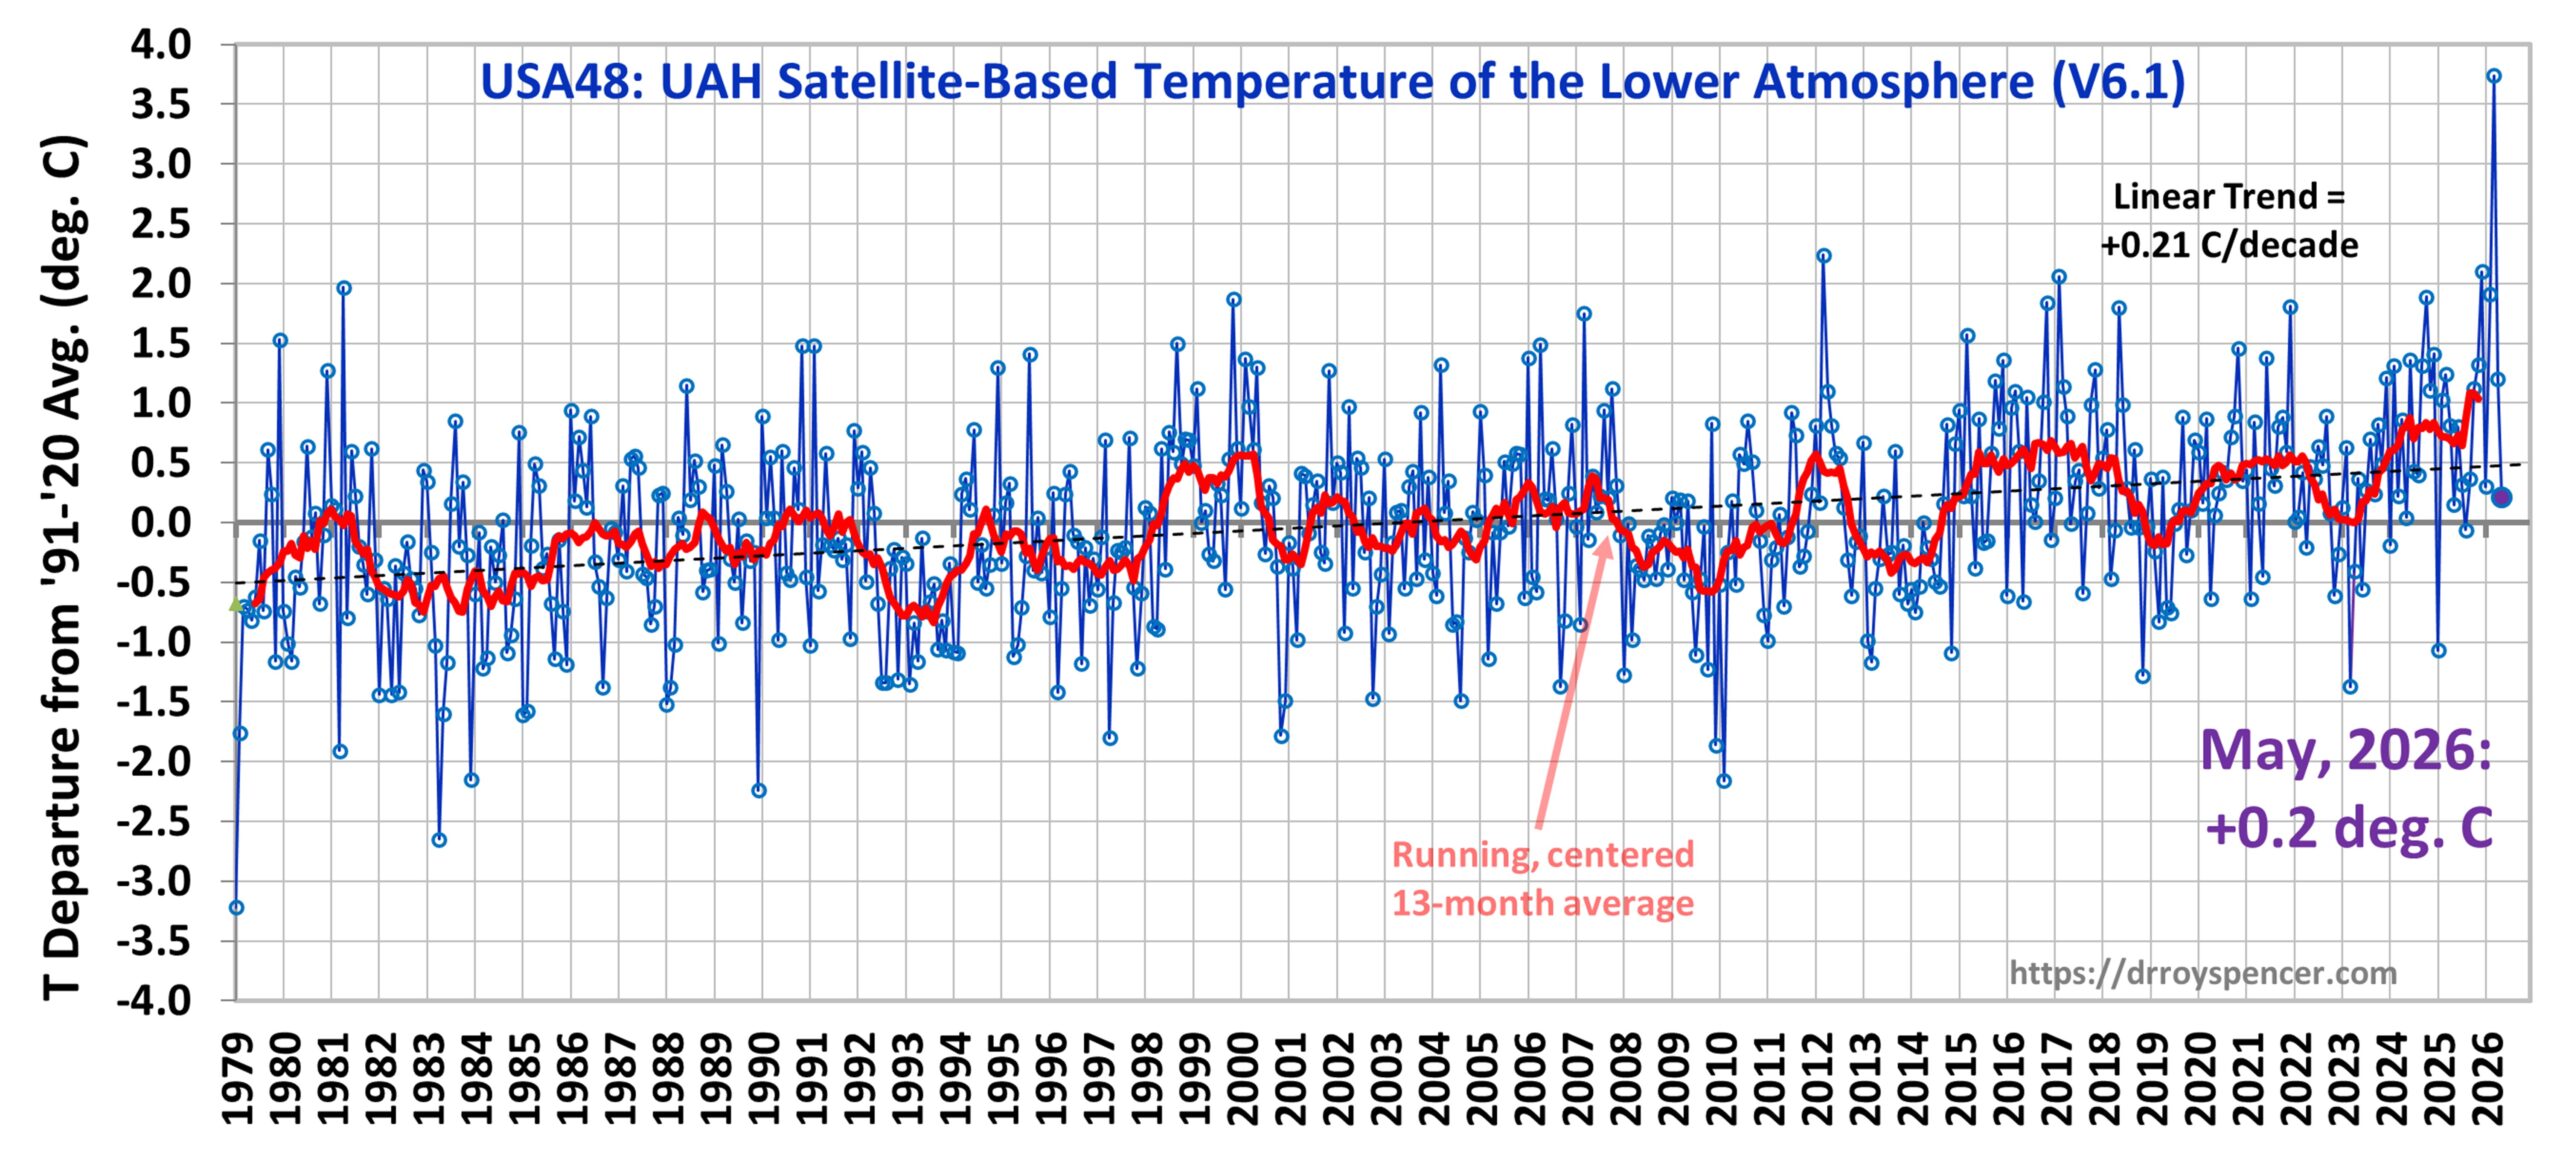
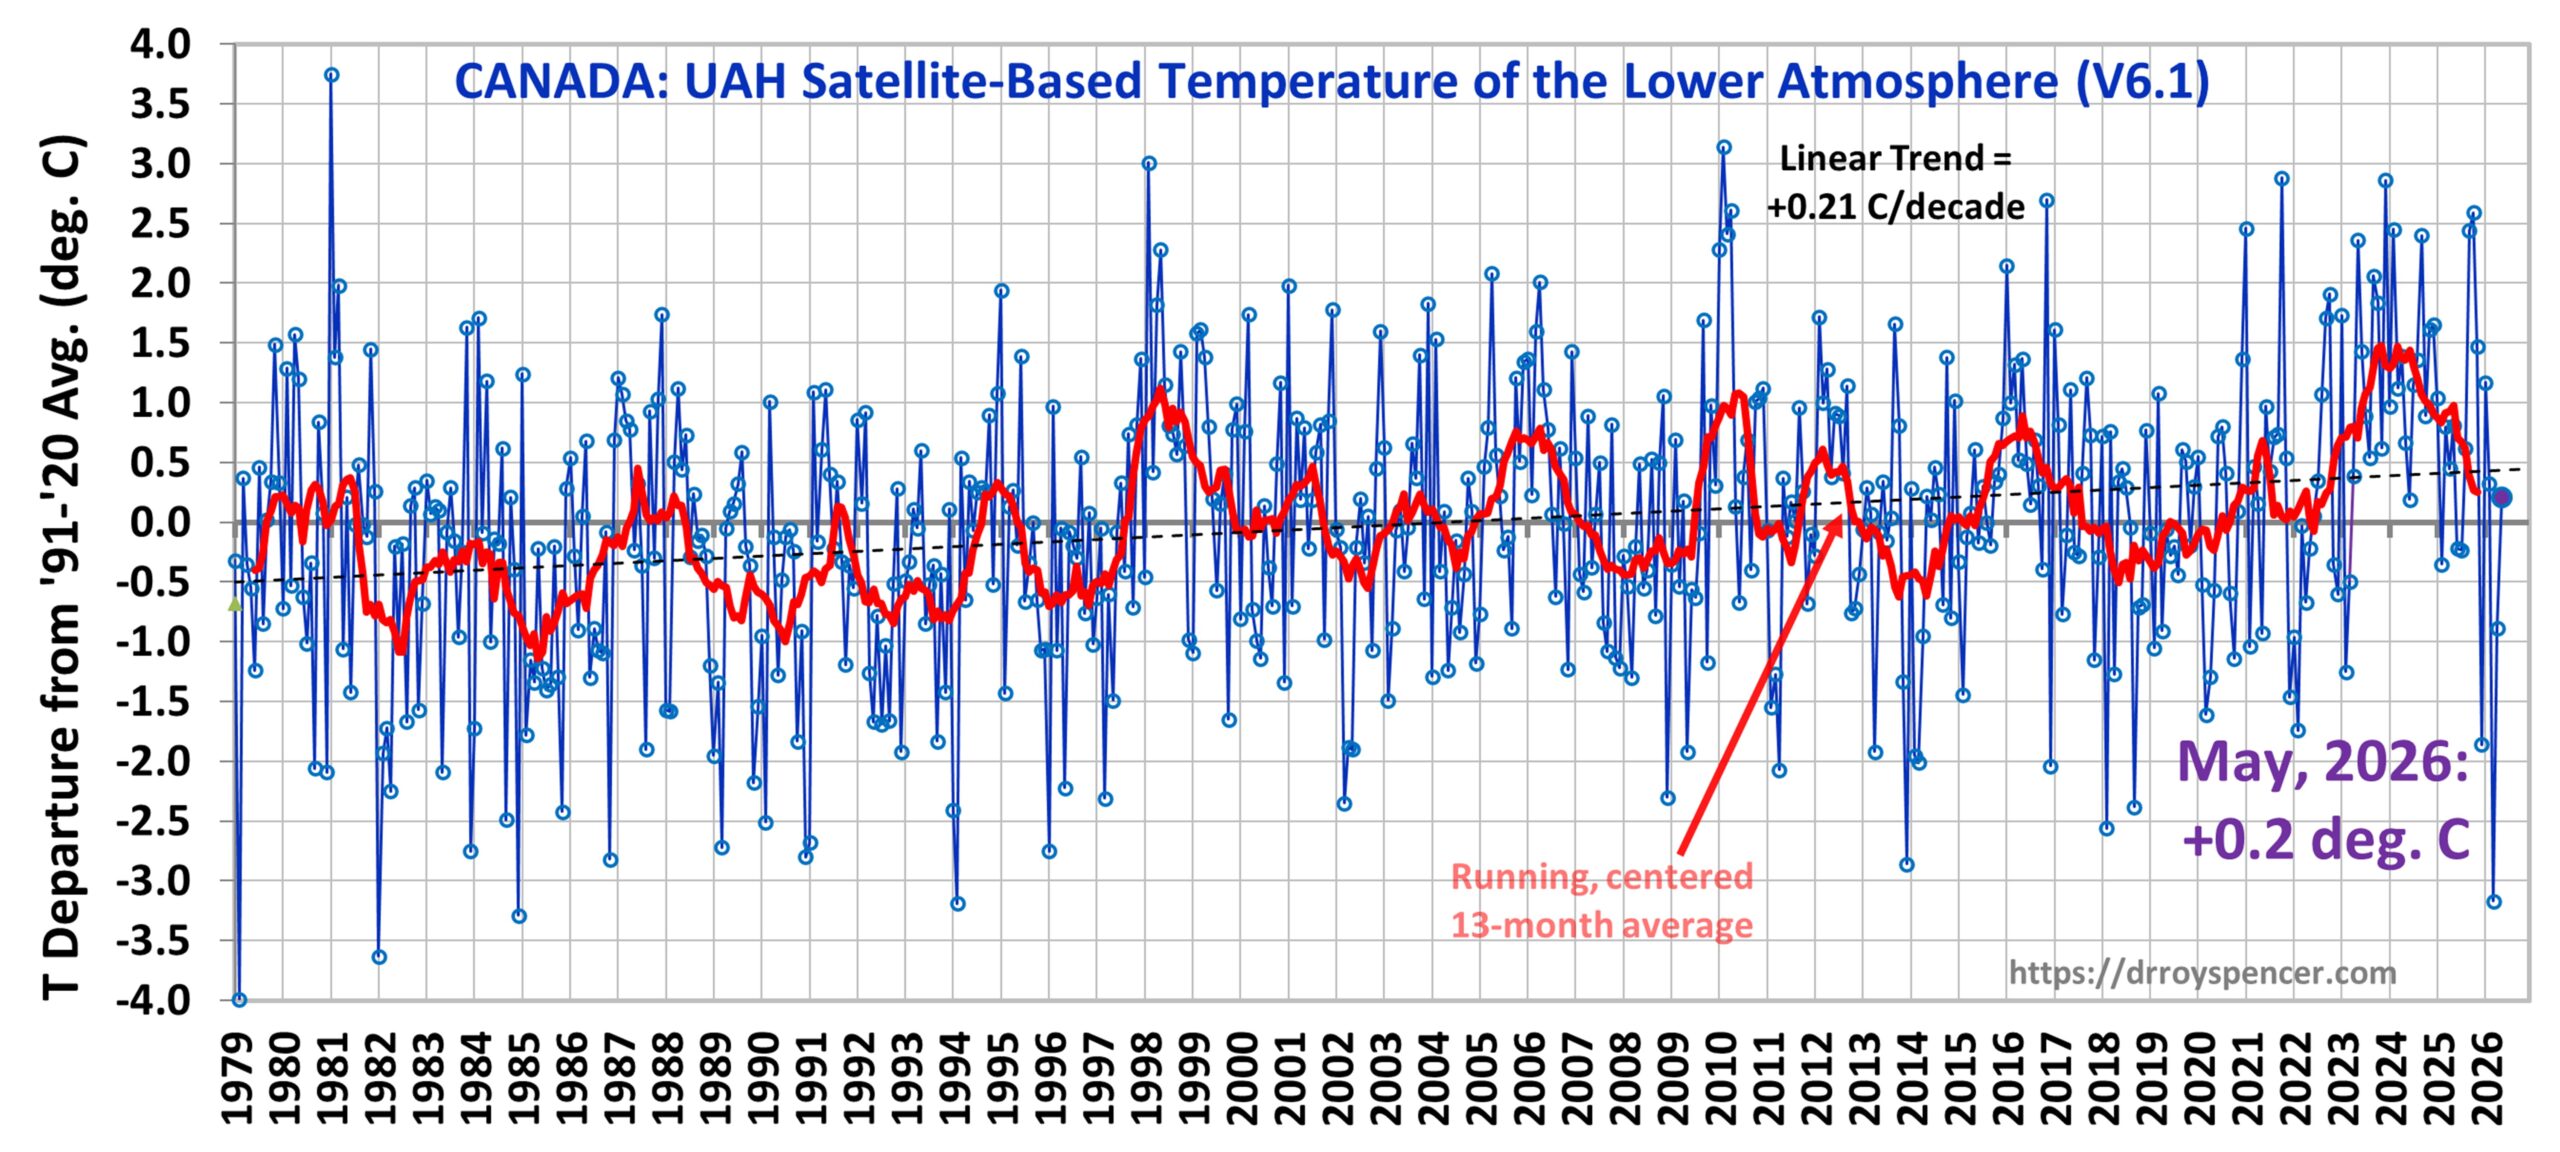
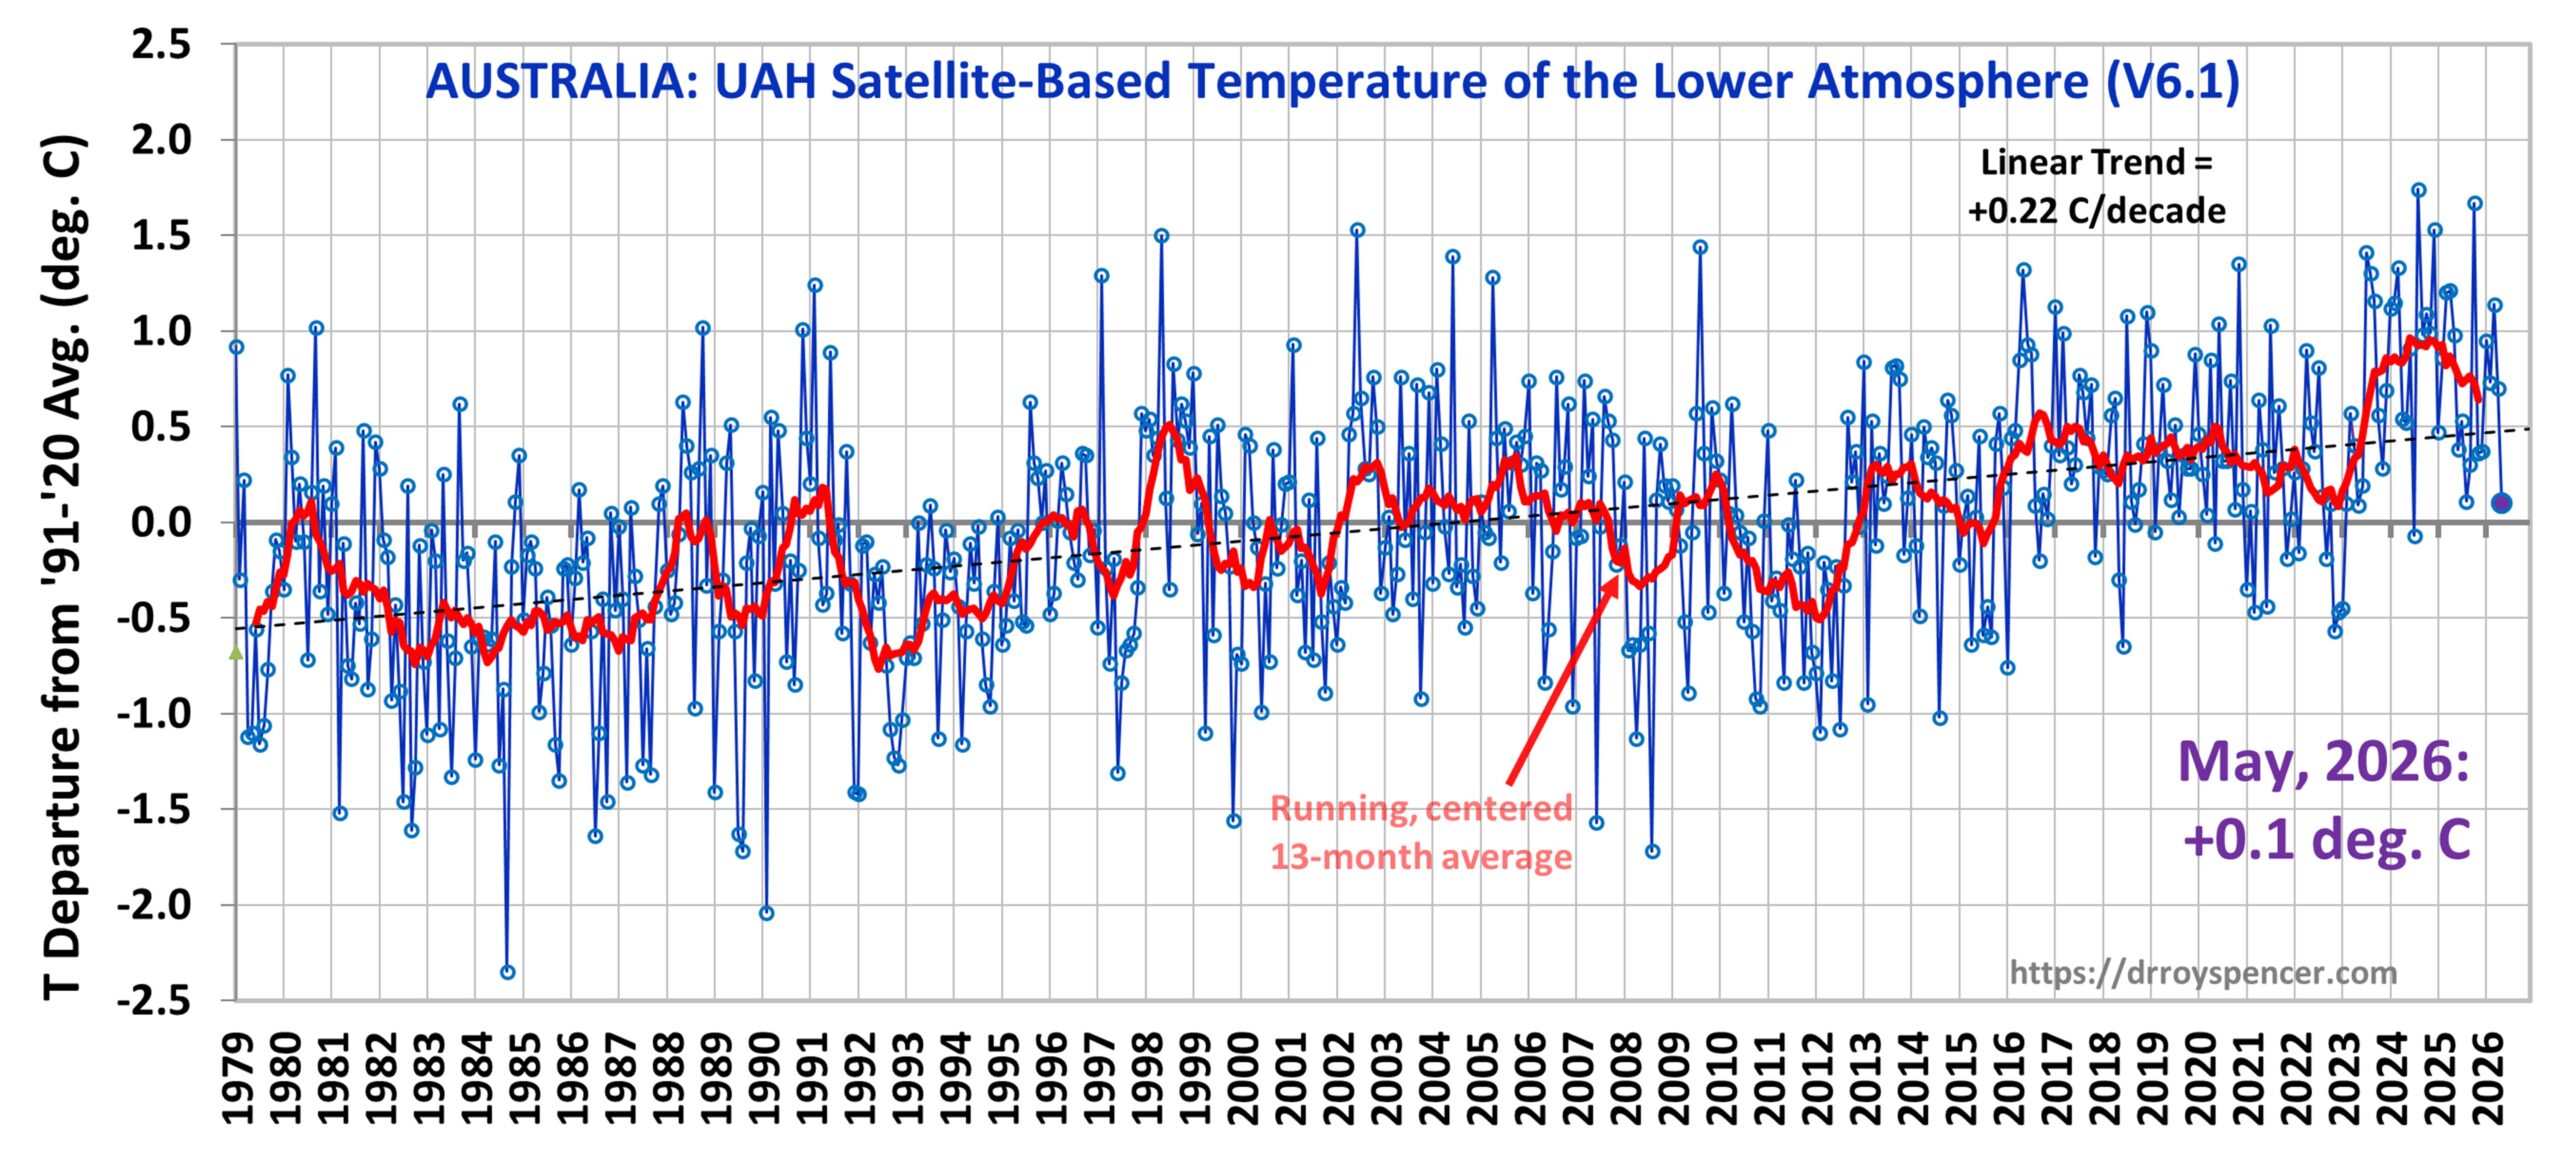
This month I’m adding Australia to the Global, USA48, and Canada time series plots.
The Version 6.1 global average lower tropospheric temperature (LT) anomaly for May, 2026 was +0.53 deg. C departure from the 1991-2020 mean, which is up from the April, 2026 value of +0.39 deg. C..
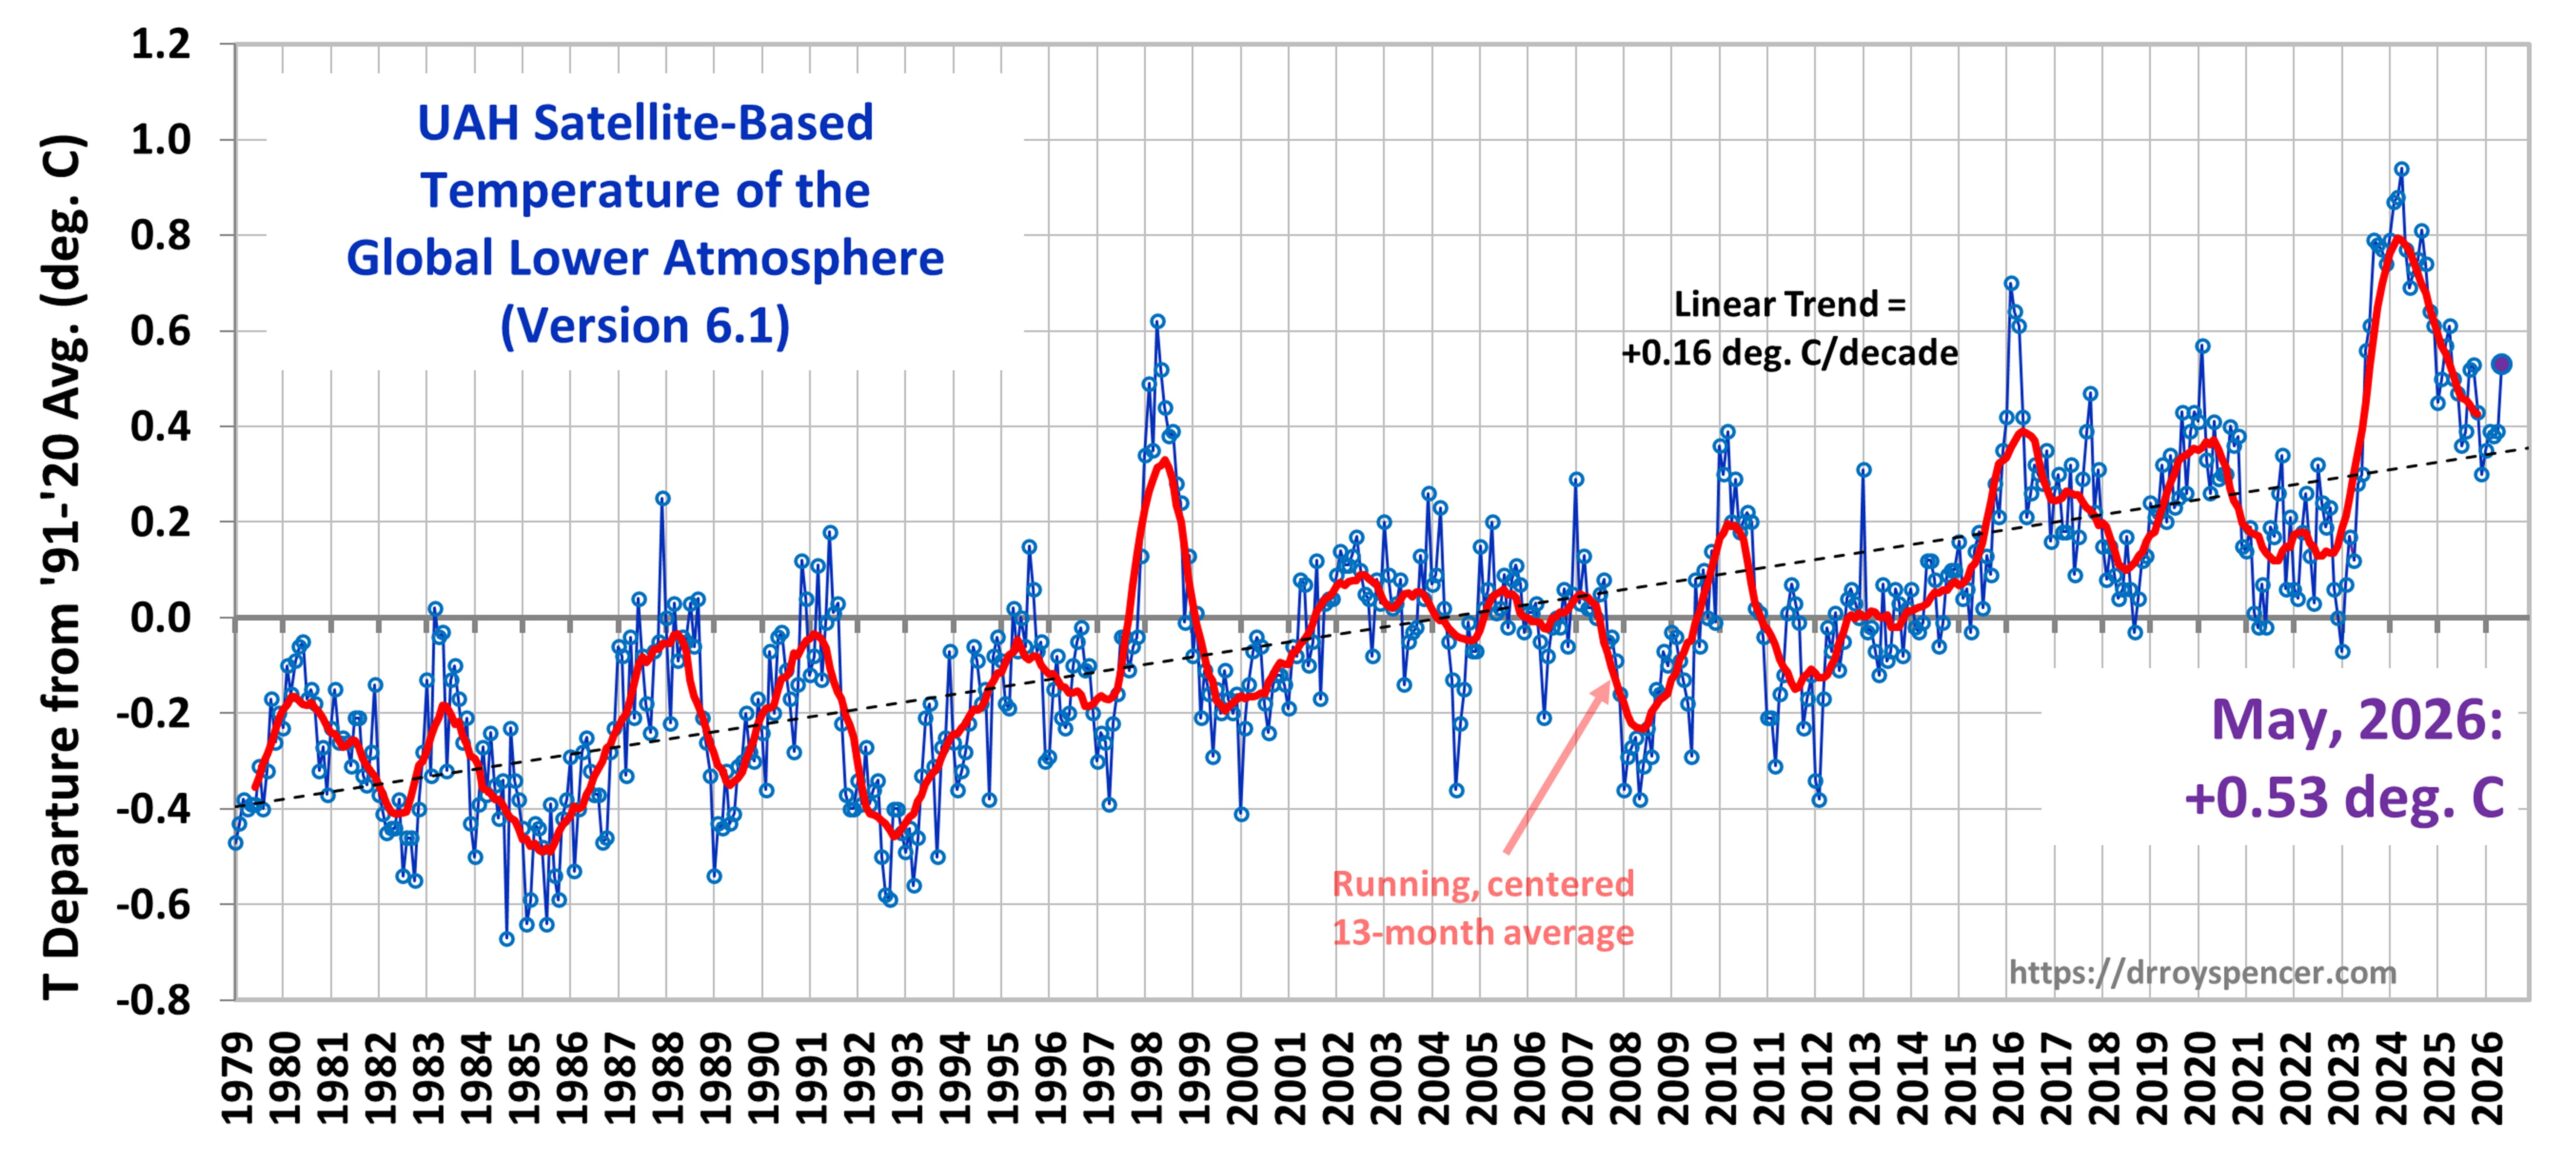
The Version 6.1 global area-averaged linear temperature trend (January 1979 through May 2026) remains at +0.16 deg/ C/decade (+0.22 C/decade over land, +0.13 C/decade over oceans).
A Note on These Tropospheric Temperature Anomalies vs. Surface Temperature Anomalies
It has been a while since I have discussed the main reason why our global monthly satellite-based tropospheric temperature anomalies can sometimes differ by quite a lot from the global monthly surface temperature anomalies. A good example is the last 2 months. In April, our +0.39 deg. C anomaly was statistically identical to the +0.38 deg. C surface temperature anomaly from the NOAA Climate Data Assimilation System (CDAS, which I take from WeatherBell.com maps). But then last month (May) the CDAS anomaly went down slightly (+ 0.34 deg. C), while our UAH anomaly went up considerably (+0.53 deg. C). These month-to-month fluctuations in the relationship between surface and tropospheric temperature changes are almost certainly dominated by fluctuations in moist convective heat transfer from the surface to the free troposphere. When there is a burst of extra convection (usually in the tropics), it cools the surface and warms the free troposphere more than normal, which is probably what happened last month (May).
The following table lists various regional Version 6.1 LT departures from the 30-year (1991-2020) average for the last 29 months (record highs are in red).
| Year | Mon | Globe | NHem | SHem | Tropic | US48 | Arctic | Aust. | Can. |
| 2024 | Jan | +0.80 | +1.02 | +0.57 | +1.20 | -0.19 | +0.40 | +1.12 | +0.97 |
| 2024 | Feb | +0.88 | +0.94 | +0.81 | +1.16 | +1.31 | +0.85 | +1.16 | +2.45 |
| 2024 | Mar | +0.88 | +0.96 | +0.80 | +1.25 | +0.22 | +1.05 | +1.34 | +1.12 |
| 2024 | Apr | +0.94 | +1.12 | +0.76 | +1.15 | +0.86 | +0.88 | +0.54 | +1.39 |
| 2024 | May | +0.77 | +0.77 | +0.78 | +1.20 | +0.04 | +0.20 | +0.52 | +0.67 |
| 2024 | June | +0.69 | +0.78 | +0.60 | +0.85 | +1.36 | +0.63 | +0.91 | +0.19 |
| 2024 | July | +0.73 | +0.86 | +0.61 | +0.96 | +0.44 | +0.56 | -0.07 | +1.15 |
| 2024 | Aug | +0.75 | +0.81 | +0.69 | +0.74 | +0.40 | +0.88 | +1.75 | +1.36 |
| 2024 | Sep | +0.81 | +1.04 | +0.58 | +0.82 | +1.31 | +1.48 | +0.98 | |
| 2024 | Oct | +0.75 | +0.89 | +0.60 | +0.63 | +1.89 | +0.81 | +1.09 | +0.89 |
| 2024 | Nov | +0.64 | +0.87 | +0.40 | +0.53 | +1.11 | +0.79 | +1.00 | +1.61 |
| 2024 | Dec | +0.61 | +0.75 | +0.47 | +0.52 | +1.41 | +1.12 | +1.54 | +1.65 |
| 2025 | Jan | +0.45 | +0.70 | +0.21 | +0.24 | -1.07 | +0.74 | +0.48 | +1.04 |
| 2025 | Feb | +0.50 | +0.55 | +0.45 | +0.26 | +1.03 | +2.10 | +0.87 | -0.35 |
| 2025 | Mar | +0.57 | +0.73 | +0.41 | +0.40 | +1.24 | +1.23 | +1.20 | +0.80 |
| 2025 | Apr | +0.61 | +0.76 | +0.46 | +0.36 | +0.81 | +0.85 | +1.21 | +0.45 |
| 2025 | May | +0.50 | +0.45 | +0.55 | +0.30 | +0.15 | +0.75 | +0.98 | +0.81 |
| 2025 | June | +0.48 | +0.48 | +0.47 | +0.30 | +0.80 | +0.05 | +0.39 | -0.22 |
| 2025 | July | +0.36 | +0.49 | +0.23 | +0.45 | +0.32 | +0.40 | +0.53 | -0.23 |
| 2025 | Aug | +0.39 | +0.39 | +0.39 | +0.16 | -0.06 | +0.82 | +0.11 | +0.62 |
| 2025 | Sep | +0.53 | +0.56 | +0.49 | +0.35 | +0.38 | +0.77 | +0.30 | +2.44 |
| 2025 | Oct | +0.53 | +0.52 | +0.55 | +0.24 | +1.12 | +1.42 | +1.67 | +2.59 |
| 2025 | Nov | +0.43 | +0.59 | +0.27 | +0.24 | +1.32 | +0.78 | +0.36 | +1.47 |
| 2025 | Dec | +0.30 | +0.45 | +0.15 | +0.19 | +2.10 | +0.32 | +0.37 | -1.86 |
| 2026 | Jan | +0.35 | +0.51 | +0.19 | +0.09 | +0.30 | +1.40 | +0.95 | +1.17 |
| 2026 | Feb | +0.39 | +0.54 | +0.23 | +0.03 | +1.91 | -0.48 | +0.73 | +0.32 |
| 2026 | Mar | +0.38 | +0.33 | +0.42 | +0.07 | +3.74 | -0.48 | +1.14 | -3.17 |
| 2026 | Apr | +0.39 | +0.43 | +0.34 | +0.23 | +1.20 | +0.30 | +0.70 | -0.89 |
| 2026 | May | +0.53 | +0.53 | +0.53 | +0.58 | +0.21 | +0.33 | +0.10 | +0.21 |
| Year | Mon | Globe | NHem | SHem | Tropic | US48 | Arctic | Aust. | Can. |
Time Series Plots for USA48, Canada, and Australia
The full UAH Global Temperature Report, along with the LT global gridpoint anomaly map for May, 2026 and a more detailed analysis by John Christy, should be available within the next several days here.
The monthly anomalies for various regions for the four deep layers we monitor from satellites will be available in the next several days at the following locations:
This piece originally appeared at DrRoySpencer.com and has been republished here with permission.